How to use the Pharo Debugger
In Smalltalk, the Debugger is a diagnostic tool for investigating software defects or bugs. However, unlike debuggers in other languages, the Smalltalk Debugger can also be used to program, that is to say, to write your application! This can be an enormously convenient and powerful approach to programming.
Let’s illustrate this with an example. We have a really simple class called #Counter:
Object subclass: #Counter
   instanceVariableNames: 'count'
   classVariableNames: ''
   package: 'Tutorial'Counter>>initialize
   count := 0Counter>>addOne
   count := count - 1Counter>>count
   ^ countCounter>>count: c
   count := c
There are several ways to invoke the Debugger:
- Your program encounters a fatal error such as “did not understand message so-and-so”
- You highlight an expression in Playground and right-click to select ‘Debug it’ (or press Ctrl-Shift-D)
- If you insert a ‘Halt now’ statement in your code, the Debugger will pop up when the statement is executed
Let’s execute the following in Playground:
Counter new addOneIf you inspect it (by highlighting and right-clicking to select ‘Inspect it’), you’ll see that the value of ‘count’ is -1, not what we expected.
We can debug (investigate) this by entering the Debugger (right-click to select ‘Debug it’).

Note that there are three panes. The Stack pane is where you can see the complete execution “stack” for your program. (A stack is a data structure used to keep track of what functions or methods are presently executing in your program. It’s called a stack because as one method calls another which calls another which calls another, you accumulate a stack of execution instances which is very useful for tracing execution behaviour.)
The Source pane is where you can see and edit the source code for a particular function or method in the stack. The Variables pane shows all the variables (including local variables, instance variables, and pseudo-variables) that are accessible to the method. The information shown in the Debugger is all you need to understand what is going on. As you analyze this information, you will be able to deduce the source of your bug.
The Evaluator is a Playground-like window for evaluating expressions involving the variables. This can help you understand what is going on.
The Debugger provides a number of possible actions for exploring the behaviour of your program. At the top of the Stack pane, you can see several options:
- Proceed — continue normal execution as if nothing interrupted
- Restart — you’ve gone too far, so start again from the beginning of the current method
- Into — execute the highlighted message/method and step into it to explore further
- Over — execute the highlighted message/method and step over it, not into it
- Through — execute through the method and into the argument block
So we see in the Debugger that method #new is highlighted. That’s the method about to be executed. We’re not interested in that one; we want to examine method #addOne. Let’s click on ‘Over’ to step over to #addOne.
Now we want to step into #addOne, so click on ‘Into’. We see the code in the Source pane. A quick look makes it obvious what is wrong (normally, you would have to analyze the code much more carefully and thoroughly): instead of an add operator, we have a subtract operator. So we can make a change to the code immediately right then and there, and save:
addOne
   count := count + 1
Now we can continue with execution (by right-clicking to select ‘Proceed’) as if nothing was wrong! That’s the power of live coding in Smalltalk.
We fixed #addOne. Now let’s give method #subtractOne a shot. In Playground, we do the following:
Counter new subtractOneUp pops a notifier window proclaiming that Pharo “does not understand #subtractOne”! That’s because method #subtractOne does not yet exist.
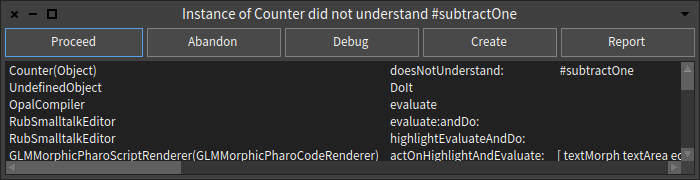
The notifier window offers several possible actions:
- Proceed — continue normal execution
- Abandon — abandon execution
- Debug — open the Debugger
- Create — create the nonexistent method
- Report — this is a deprecated function, removed in Pharo 7.0
We have the opportunity to create the missing method immediately by clicking on ‘Create’. It will then ask what class and protocol to put the new method into. Add the following code:
Counter>>subtractOne
   count := count - 1
Then save this and continue execution.
Not only can you create methods, you can create classes in the Debugger. If you code a nonexistent class in your method and try to save, the Debugger will give you an opportunity to “Create new class” from a pop-up window.
As you can see, you can use the Debugger to write code just as easily as you do in the System Browser. In this way, you can iteratively write code and debug, write code and debug, all the while seeing exactly what’s going on in your program. It’s a very powerful and holistic way to develop software. I encourage you to master this approach.